A.I Technical Screener
Award-winning insights for your platform.
A.I Technical Screener empowers your investing customers of all skill-levels to optimize their trading strategies through a combination of actionable technical analysis, educational guidance and customizable alerts.
On May 24th 2018, A.I Technical Screener was awarded the “Best Specialist Award” at the Technical Analyst Awards.

Concise Support in the moments that Matter.
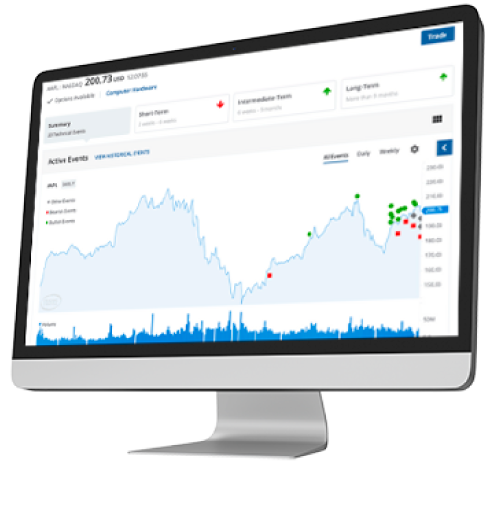
There’s no need for traders to sift through details before making a decision or placing a trade… A.I Technical Screener does all the heavy crunching required, delivering concise, actionable insight in the moment it’s needed. Using a proprietary weight-of-evidence approach, the “Technical Score” displays the directional outlook of either bullish, bearish or neutral, across short to long timeframes, communicating key directional information at a glance.

Uniquely Transparent & Educational
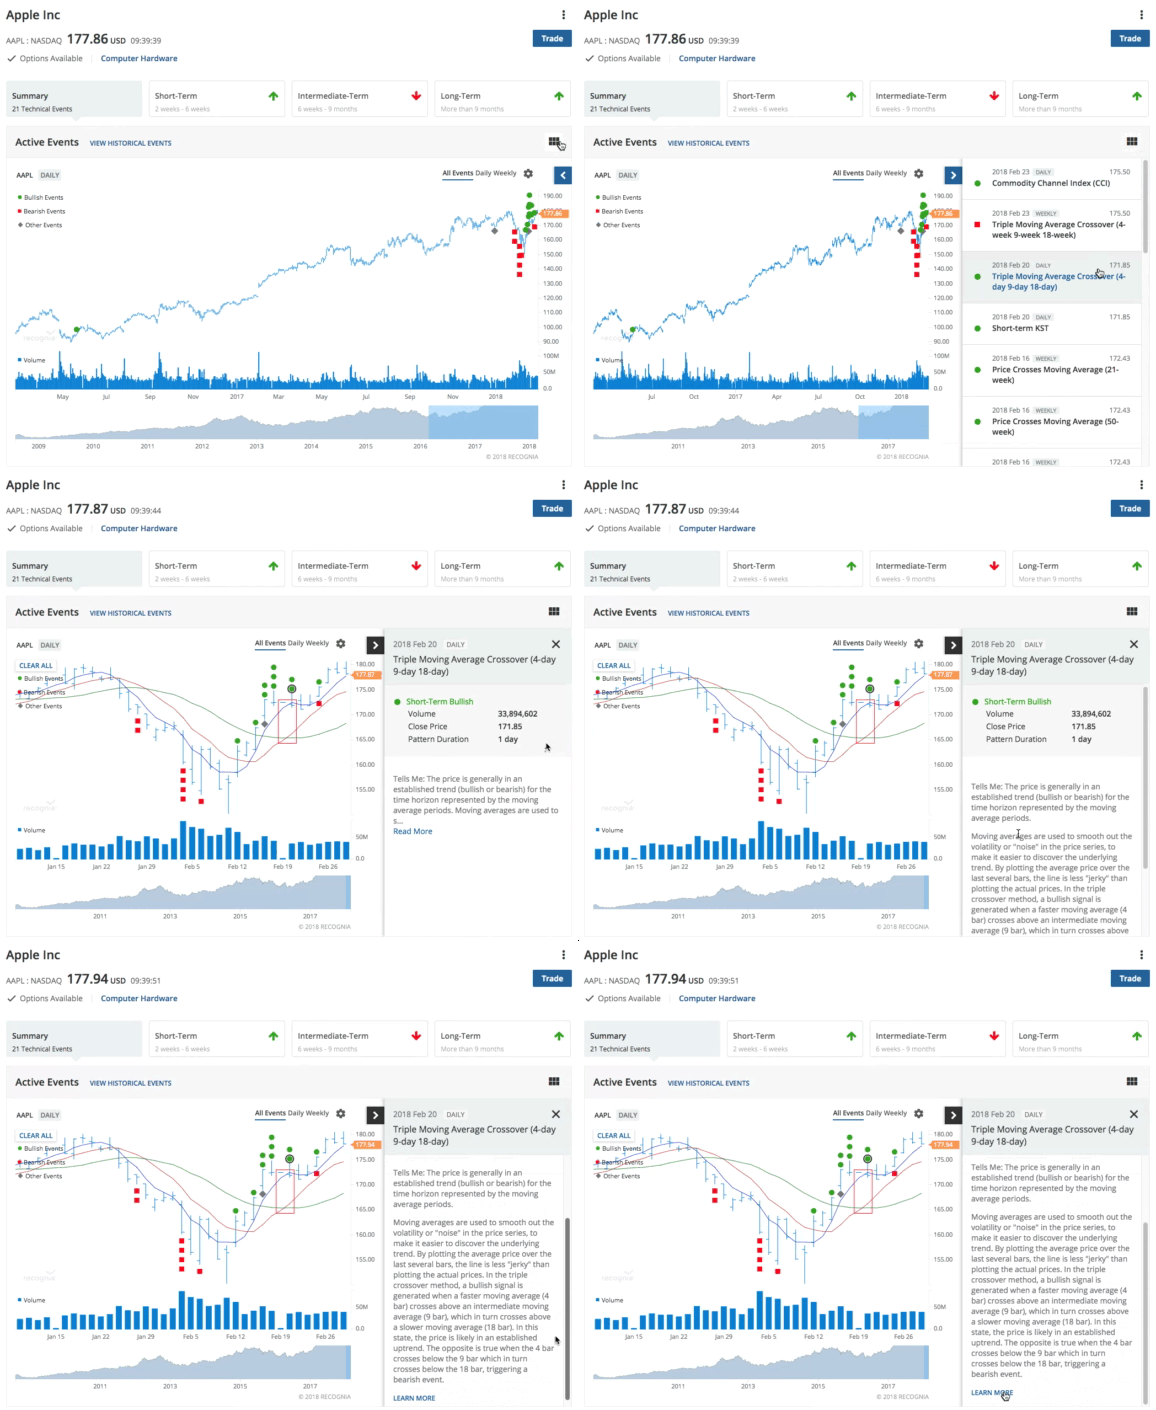
Each Technical Event® includes educational commentary and other data about the event and its expected impact on price action. Traders can continue to learn about any instrument through “Learn more” and “View Historical Events” buttons. This progressive disclosure of information provides new traders a jumping off point to begin trading and the ability to continue learning at their own pace.

Modern and User Friendly experiences
With its responsive, touch-friendly design, and the ability to bookmark and share trade ideas, traders are able to stay engaged with A.I Technical Screener anytime, anywhere. Furthermore, the concise nature of our alerts and Technical Summary Score add-on are perfect for mobile messaging, keeping traders in the know— even when they’re on the go.

AWARD-WINNING TECHNICAL ANALYSIS
Engage, Educate & Empower.
Through a balanced feature set of detailed, proactive analytics, educational guidance and customizable options, A.I Technical Screener empowers traders of all skill levels to take control of their investments.

Education In Context
Traders don't need to remember every pattern to act according. They can hover over any Technical Event to see what it means for that instrument or "Read More" to learn at their own pace.
Simplified Risk Management
Support & Resistance lines are drawn on the chart, making you aware of significant price levels to help with potential entry and exit points and manage risk.
Show your investors that you're innovating...
Through a balanced feature set of detailed real-time data, educational guidance and customizable
options,
the TC Economic Calendar empowers investors of all skill levels to take control of
their investments.

Traders don't need to remember every pattern to act according. Hover over any Technical Event to see what it means for that instrument.


Our easy alerts notify you of key changes with an instrument or Technical Events matching your custom screening criteria so you can act timely if needed.

Perfect for mobile messaging, keeping traders in the know— even when they’re on the go.

Our support & resistance lines are drawn on the chart, making you aware of significant price levels to help with potential entry and exit points and manage risk.

Want to see a chart in more detail? No problem. Zoom in on any technical event.

Our concise technical outlook of Bullish, Bearish or Neutral across three timeframes to deliver analysis in the moment of action.
 English
 TIẾNG VIỆT
 简体中文
简体中文
 Malay
Malay
 Español
 Deutsch
 Italiano
 Français
 Indonesia

