English
 TIẾNG VIỆT
 简体中文
简体中文
 Malay
Malay
 Español
 Deutsch
 Italiano
 Français
 Indonesia
Find, validate & time your trades with A.I Technical Screener
Find, validate & time your trades with
A.I Technical Screener
A.I Technical Screener™ delivers actionable technical analysis on virtually every financial instrument (over 75,000!) to help traders like you make confident decisions and optimize their trading strategies. By automatically analyzing price charts to detect signs of strength and weakness, and combining with tools for educational commentary, advanced filtering and simple alerts, A.I Technical Screener empowers traders of all skill levels to take control of their investments.
Find actionable trade ideas
Welcome to your landing page!
Here you can use the search bar, a list of recent searches and emerging opportunities based on popularity, price direction and trading volume.
Have a specific investment in mind?
Type any ticker or name into our easy search bar and you'll get instant insight about which technical events are currently active, and what are important support and resistance levels.
Want to explore a specific asset class?
Click its icon from under the search bar and you'll be taken to our screener, where you can filter the latest bullish and bearish technical events based on the directional trend, patterns found, instrument price, volume market cap, and more.
Validate investment ideas
A.I Technical Screener helps you form confident investment decisions by providing an unbiased perspective on where the price may be headed, according to established practices of technical analysis.
Gain quick directional insight.
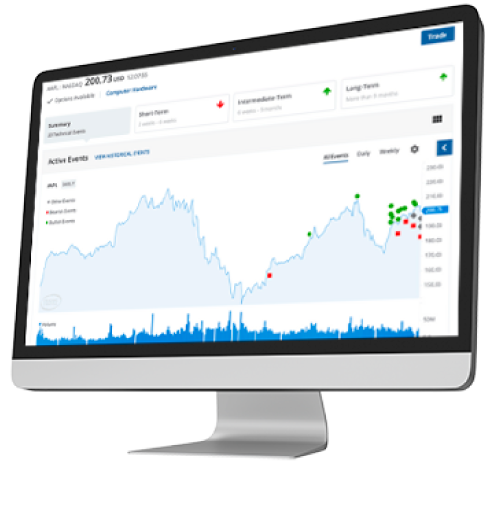
Our Technical Summary Score displays a concise directional analysis across short, intermediate and long-term timeframes. Select a timeframe to explore all technical events contributing to this weight-of-evidence analysis.
Active Technical Events
Use our interactive charts to explore the active bullish and bearish Technical Events to learn about what they mean for the instrument's price. Click to "learn more" to discover how these patterns typically form and what it tells us about buying and selling behaviour.
Monitor your ideas and portfolio
Keep an eye on instruments of interest!
Want to keep an eye on your portfolio or stocks you're evaluating? Our watchlist feature makes it simple! From here, you can quickly see the last price, the support and resistance levels, and the Summary Score!
Subscribe to get new ideas in your inbox
When screening the markets for investment opportunities, be sure to hit the SUBSCRIBE button to save your settings and get new ideas pushed to your Inbox.
Alerts made easy.
Track any ticker with our technical alerts! After you look up a specific ticker in A.I Technical Screener, click the alert BELL icon to start setting technical event alerts. Be the first to know when thye price crosses the moving average, or a new chart pattern forms, and more!
Support & Resistance
Turn on support & resistance levels by selecting the card below the chart. It's important to be aware of significant price levels that may affect trading. They can help you manage risk or select entry and exit points for your positions. Use the BELL icon to get notified when the price crosses these levels!
Know when to "stop"
Manage your risk by turning on Trailing Stops with the card below the chart. If you're not sure which percentage stop to use, try our TC Trailing Stop. The proprietary algorithm uses historical volatility to establish a stop at an “appropriate” distance from the current price. Don't forget to click the BELL icon to turn on email notifications!
Build your investing skillset
While A.I Technical Screener does the heavy lifting for you, its transparent analytics allow you to dig as deep as you like so you can learn about the principles of Technical Analysis, what each type of technical event means and what it might reveal about prices ahead.
Learn as you go!
There's no need to memorize every Technical Event to act confidently. A.I Technical Screener includes a contextual summary of all the need-to-know information directly within the research page.
Want more in-depth education?
You might want to explore our education library which indexes all the different chart patterns and indicators A.I Technical Screener covers in depth.